

John Paterson
Founder & CEO, Quadshift
Part 2: How to analyze your SaaS/ recurring revenue metrics: churn and retention
In the last article, we reviewed the process of preparing your recurring revenue data. If you missed it, check that piece out then come back here. Once our metrics are prepared, we need to analyze the results. The key metrics we look at are logo churn/retention, revenue churn/retention, and net revenue retention. Each deserves its own discussion, so let’s start with logo churn in this article.
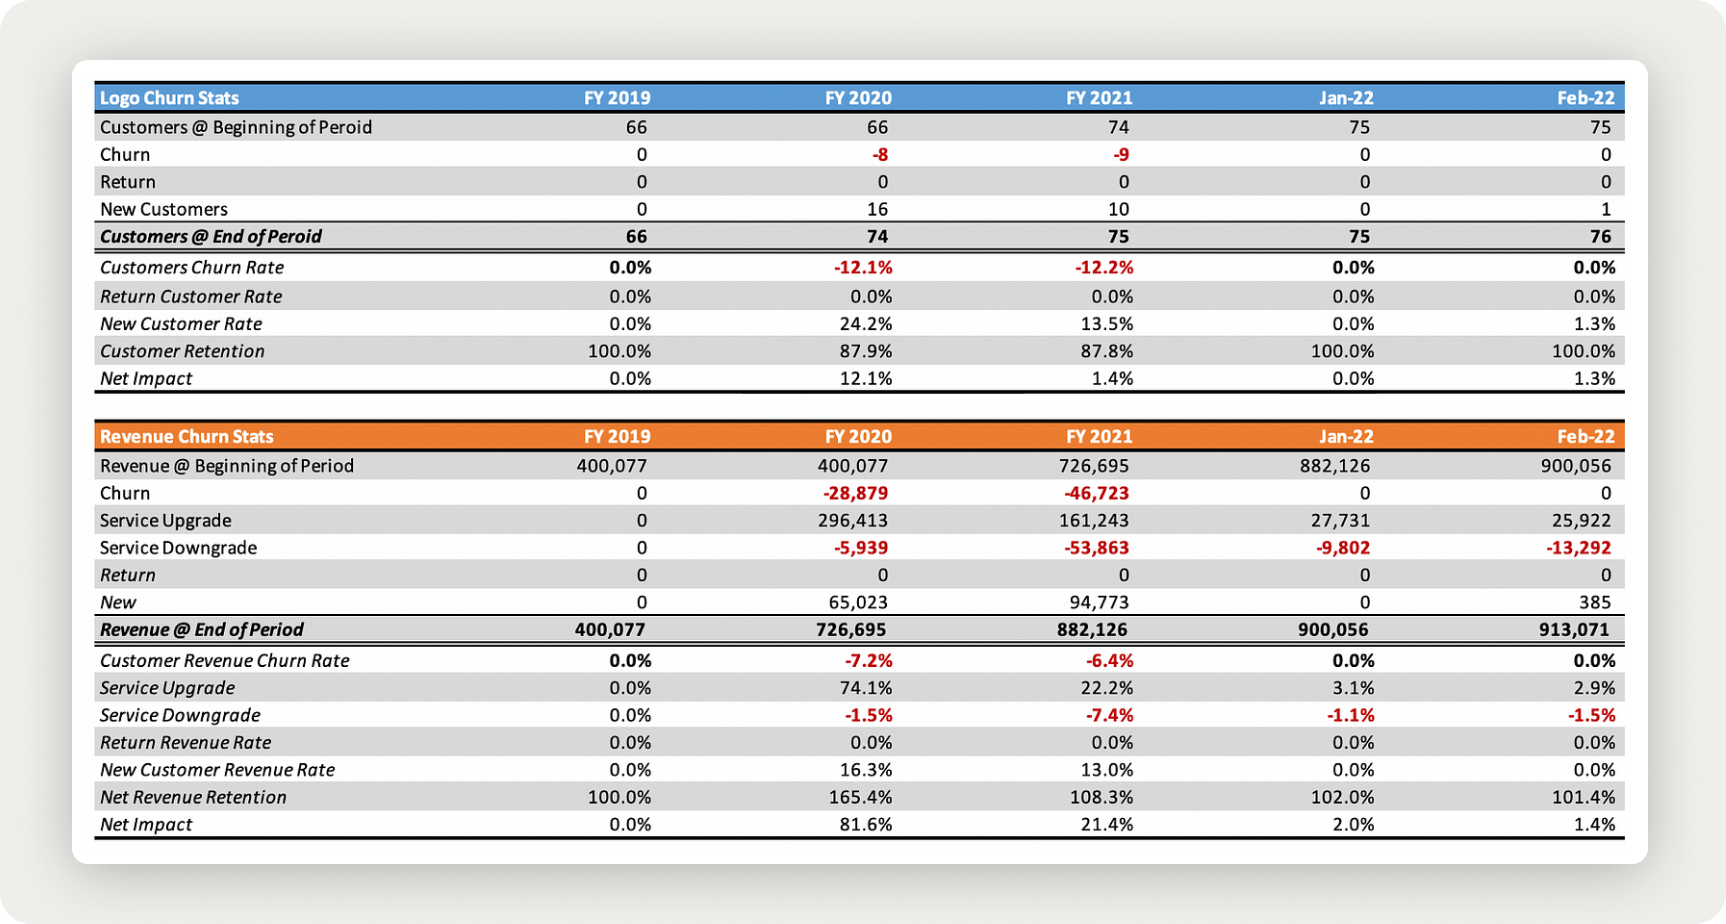
For reference, the output from the analysis (our SaaS waterfall), is below.
Logo Churn/Retention
As a reminder, logo churn/retention is the number of paying customers that churned/were retained from the previous period to the current period. If you had 100 customers yesterday and 80 of those customers are still paying customers today, you churned 20 customers and your logo churn is 20/100 = 20%.
Why is Logo Churn Important?
Retaining customers is vital to the success of any business. Logo retention, or the rate at which customers remain loyal to your company, serves as a critical indicator of customer "stickiness"—a signal that they perceive value in your products or services.
When customers stay longer, their cumulative spending with your business increases, leading to a higher Customer Lifetime Value (LTV). This metric is essential for profitability because the investment required to acquire and retain a customer must be lower than the LTV they generate for your company.
Here’s how LTV is calculated:
Customer Lifetime Value (LTV) = (Revenue — Cost of Sales) / Churn Rate
Notice the role of the churn rate in this equation. A lower churn rate leads to a higher LTV because it reflects that customers are staying with your business longer, resulting in increased revenue over time.
Why does this matter?
- Improved profitability: Retained customers generate more revenue without incurring the acquisition costs of new customers.
- Predictable growth: High logo retention stabilizes revenue streams, making future planning more reliable.
- Stronger customer relationships: Customers who stay longer are more likely to become brand advocates, contributing to organic growth through referrals and positive word-of-mouth.
Simply put, lower churn rates mean higher customer lifetime value, which directly impacts profitability and growth. This is why monitoring and improving logo churn is critical for long-term success.
How to Benchmark Churn/Retention Rates
What is a good annual retention rate? At Quadshift, we like to see annual logo retention of at least 80% for SMB SaaS, but ideally greater than 90%.
Note: any benchmark mentioned here needs to be considered along with other individual company considerations and other analyses. We will make some assumptions that may not be relevant to your business, but we do want to give some guidance without putting caveats around every statement. Reach out directly, if you want an individualized perspective on your business.
With at least 80% annual logo retention, you are losing 1.67% of your customers monthly, (and hopefully those are smaller customers), so you are keeping most of your revenue from period to period.
The size of company you serve will also impact what could be considered good.
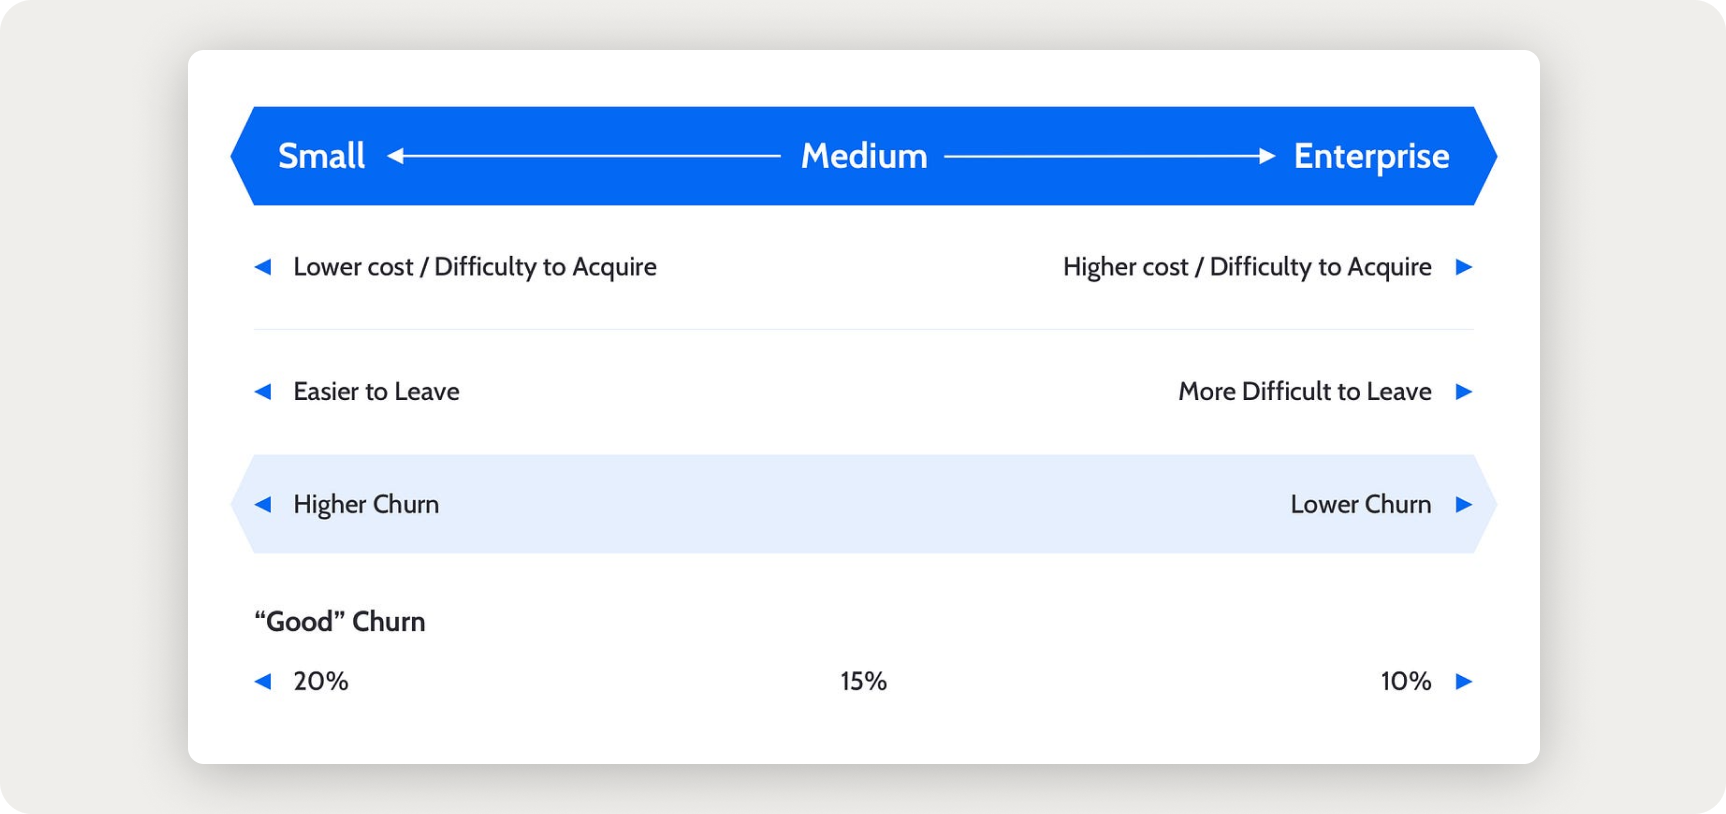
SMB (Small), vs. Medium, vs. Enterprise
If your company serves SMBs, we expect churn to be higher than if you serve medium or large enterprises. Smaller businesses can make purchase decisions quickly; they are more fluid, budgets are not fixed, and multiple layers of approvals are not needed. It also costs less to sell, or it should, since it’s a shorter sale cycle.
For companies serving SMBs, these selling characteristics are both positive and negative. From a churn perspective, it means customers can leave more easily. Inversely, it means we can add customers easily too. As we move from SMB to Medium to Enterprise, we slide along that spectrum.
Using Benchmarking Studies
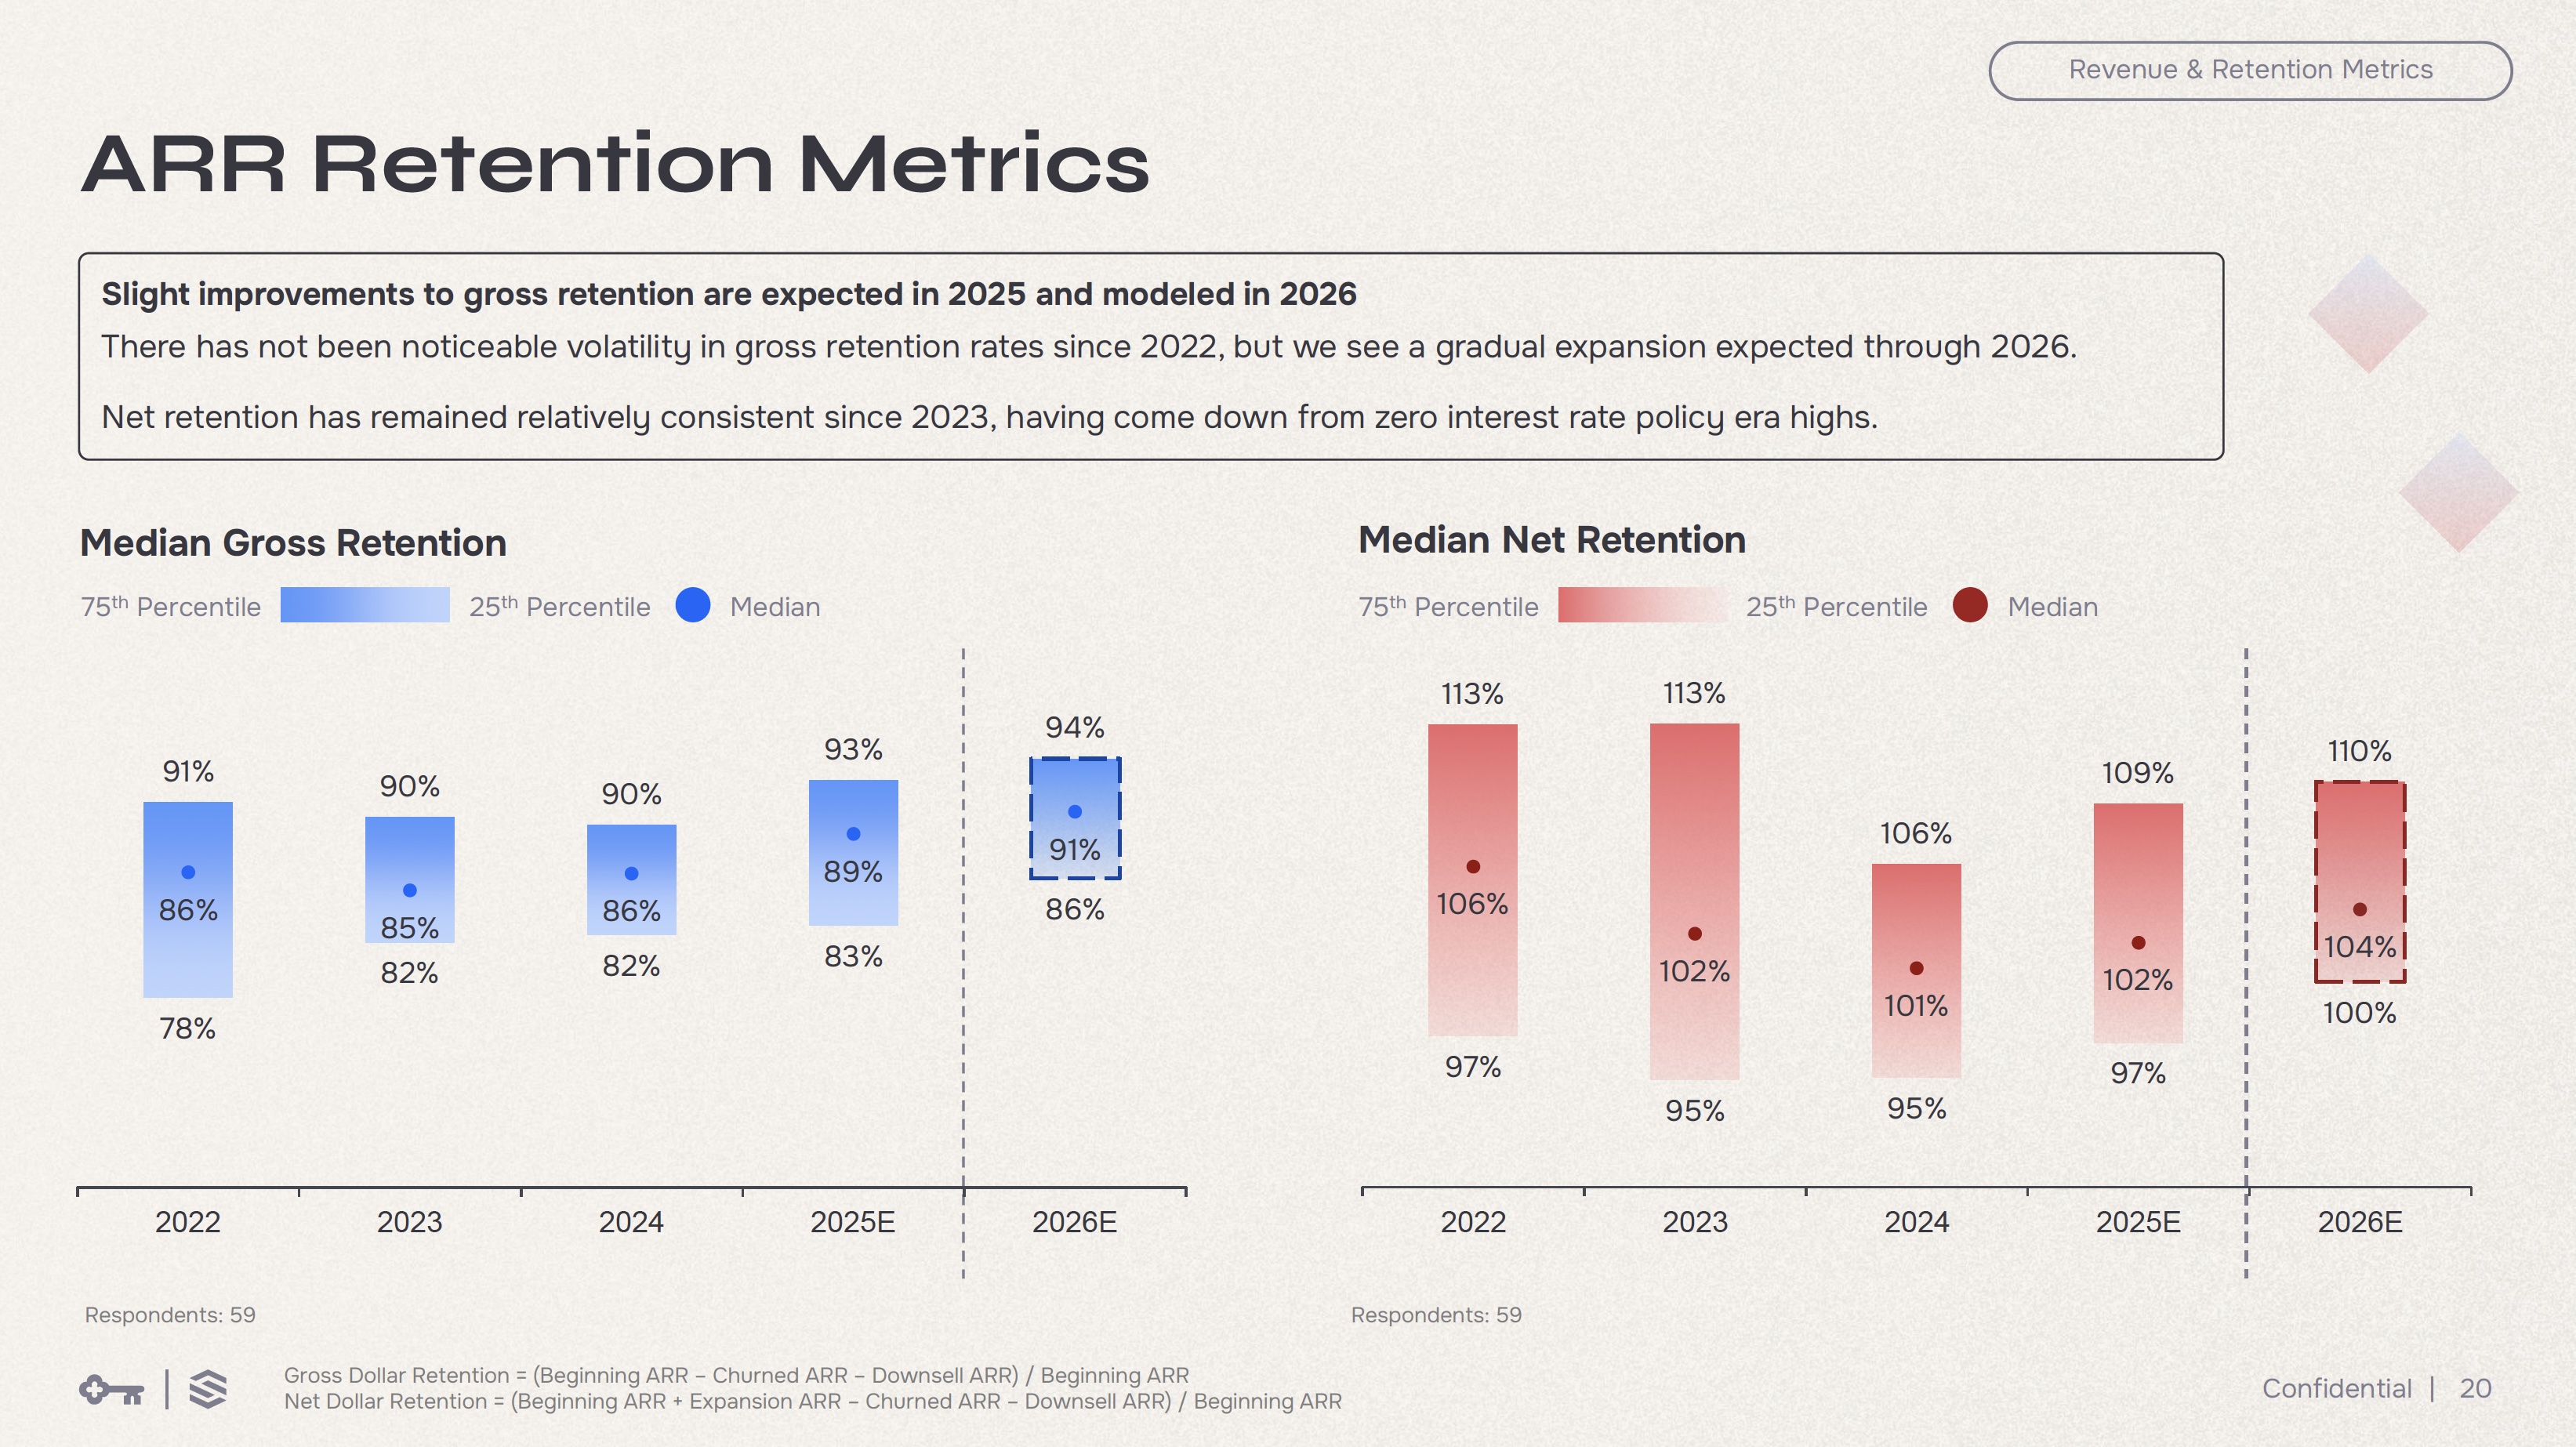
A good benchmark study to review is the KeyBanc Capital Markets & Sapphire Ventures Annual SaaS Survey. The survey does not track logo churn directly, but it does track gross dollar retention (which measures revenue retained from existing customers, excluding expansion). According to the 2025 survey (16th annual, 71 respondents, median $23M ARR), median gross dollar retention was 86% in 2022, 85% in 2023, 86% in 2024, with expectations of 89% in 2025 and 91% in 2026. Top quartile companies maintained gross retention above 90% throughout. These are primarily institutionally-backed, growth-stage SaaS companies, so it is a high-quality sample to benchmark against.
Note: It is important when comparing yourself to a benchmark that you understand who is included in the sample so you can draw meaningful conclusions. I noticed a lot of misleading churn benchmarks or benchmarks without sample details in blogs online, so be wary!
Representative statistics on the 2025 survey participants: 71 respondents with a median 2024 ARR of approximately $23 million. The majority are VC-backed (45) or PE-backed (20), primarily North American (53 of 71), and span horizontal applications (32), vertical applications (24), and infrastructure and security (15). By AI posture, 36 identified as AI-native or AI-enabled, 19 as AI-interested, and zero as non-AI.
Logo churn really needs more analysis since it alone is a crude measure. Which type of customer is churning? Why are they churning? Do certain customer groups have high retention and some low retention? We can uncover more of the story with a “customer cohort” analysis. It is an important part of the recurring revenue analysis.
Hopefully, this rundown on logo churn is a useful one. In our next article in this series, we will look at net revenue retention, a key metric in recurring revenue analysis.