

John Paterson
Founder & CEO, Quadshift
Part 3: The most important recurring revenue metric of all…
We’ve now created our SaaS metrics, in part 2 we analyzed and benchmarked our logo churn, and to close off this series we will review net revenue retention (or net dollar retention or NRR). No one metric tells the complete story, but if I were to rank them, NRR is number one.
What is NRR and why is it so important?
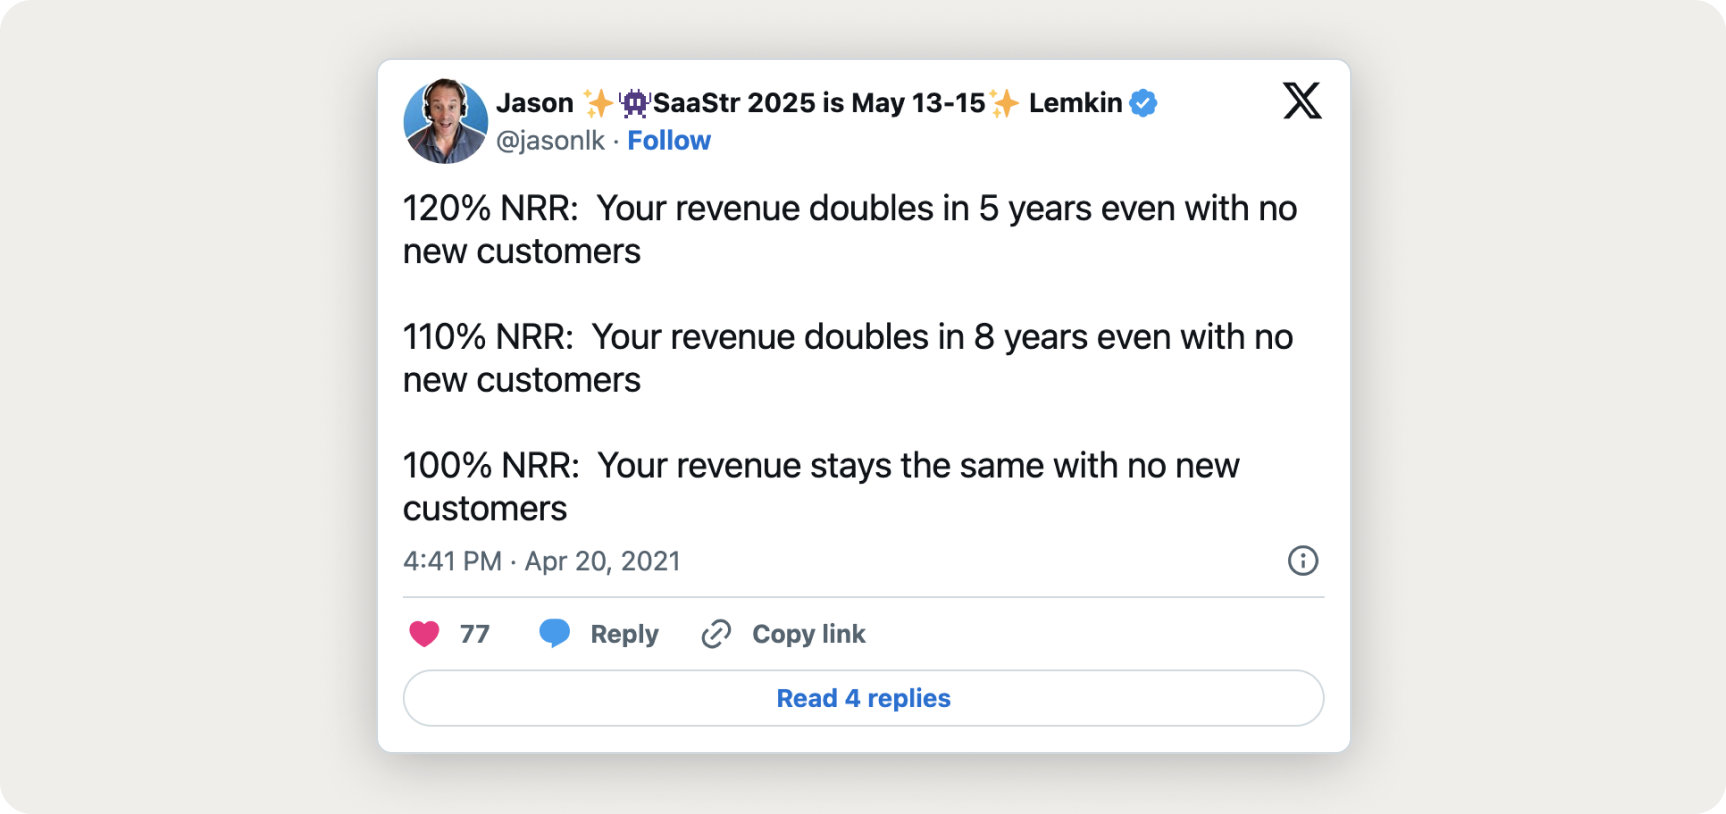
NRR tells you how revenue from existing customers is changing. If we can generate more revenue from our existing customers compared to the previous periods (NRR >100%), it means you haven’t had to bring on any new customers to grow your business. That’s pretty cool if you manage it and it indicates high-quality recurring revenue. I like this tweet from Jason Lemkin that speaks to this phenomenon:
In part 1, we reviewed the calculation. Here it is again:
NRR% = ((revenue from previous period + upgrade revenue — downgrade revenue — churned revenue)/ (total revenue from previous period)) * 100
How to Reach NRR > 100%
In order to attain greater than 100% net revenue retention, you must increase revenue from your existing customers (revenue upgrades).
There are several ways to do so:
- upselling additional features,
- cross-selling products,
- increasing the usage, volume, or seats (depending on your pricing model), and/or
- raising prices.
If you're consistently able to upgrade revenue, it is a signal your product is offering incremental value (or your customers value it enough to withstand price increases), and NRR will be > 100%, assuming churn is under control.
One lever that has become increasingly powerful: AI-driven features. Adding AI capabilities to your product (smarter automation, natural language interfaces, predictive analytics) creates natural upsell and expansion opportunities. Customers pay more because the product does more. This is one of the reasons we prioritize AI enablement across the Quadshift portfolio.
In the calculation for NRR, we also have “churned revenue”. This is the revenue impact of your logo churn. If a customer churned, this tells you how much revenue they represented (which you lost) in the prior period. While logo churn will tell you which customer segments you have traction with, many SaaS investors will view revenue churn as more important. The revenue impact of churn is what matters to your financial performance. If, for example, you have churn mostly among your small customers, your logo churn may have little impact on your financial performance.
Benchmarks for NRR
NRR benchmark
At Quadshift, we look for NRR >100 whether you serve SMBs or enterprise customers (unlike logo churn/retention where size matters). Despite the difference between enterprise and SMB, as an investor and business owner, we still want NRR above 100%. Jason Lemkin at SaaStr Academy has a piece on this worth checking out with examples of software companies that serve SMBs and why we still want NRR north of 100% → Don’t Settle for Less Than 100% NRR from SMBs.
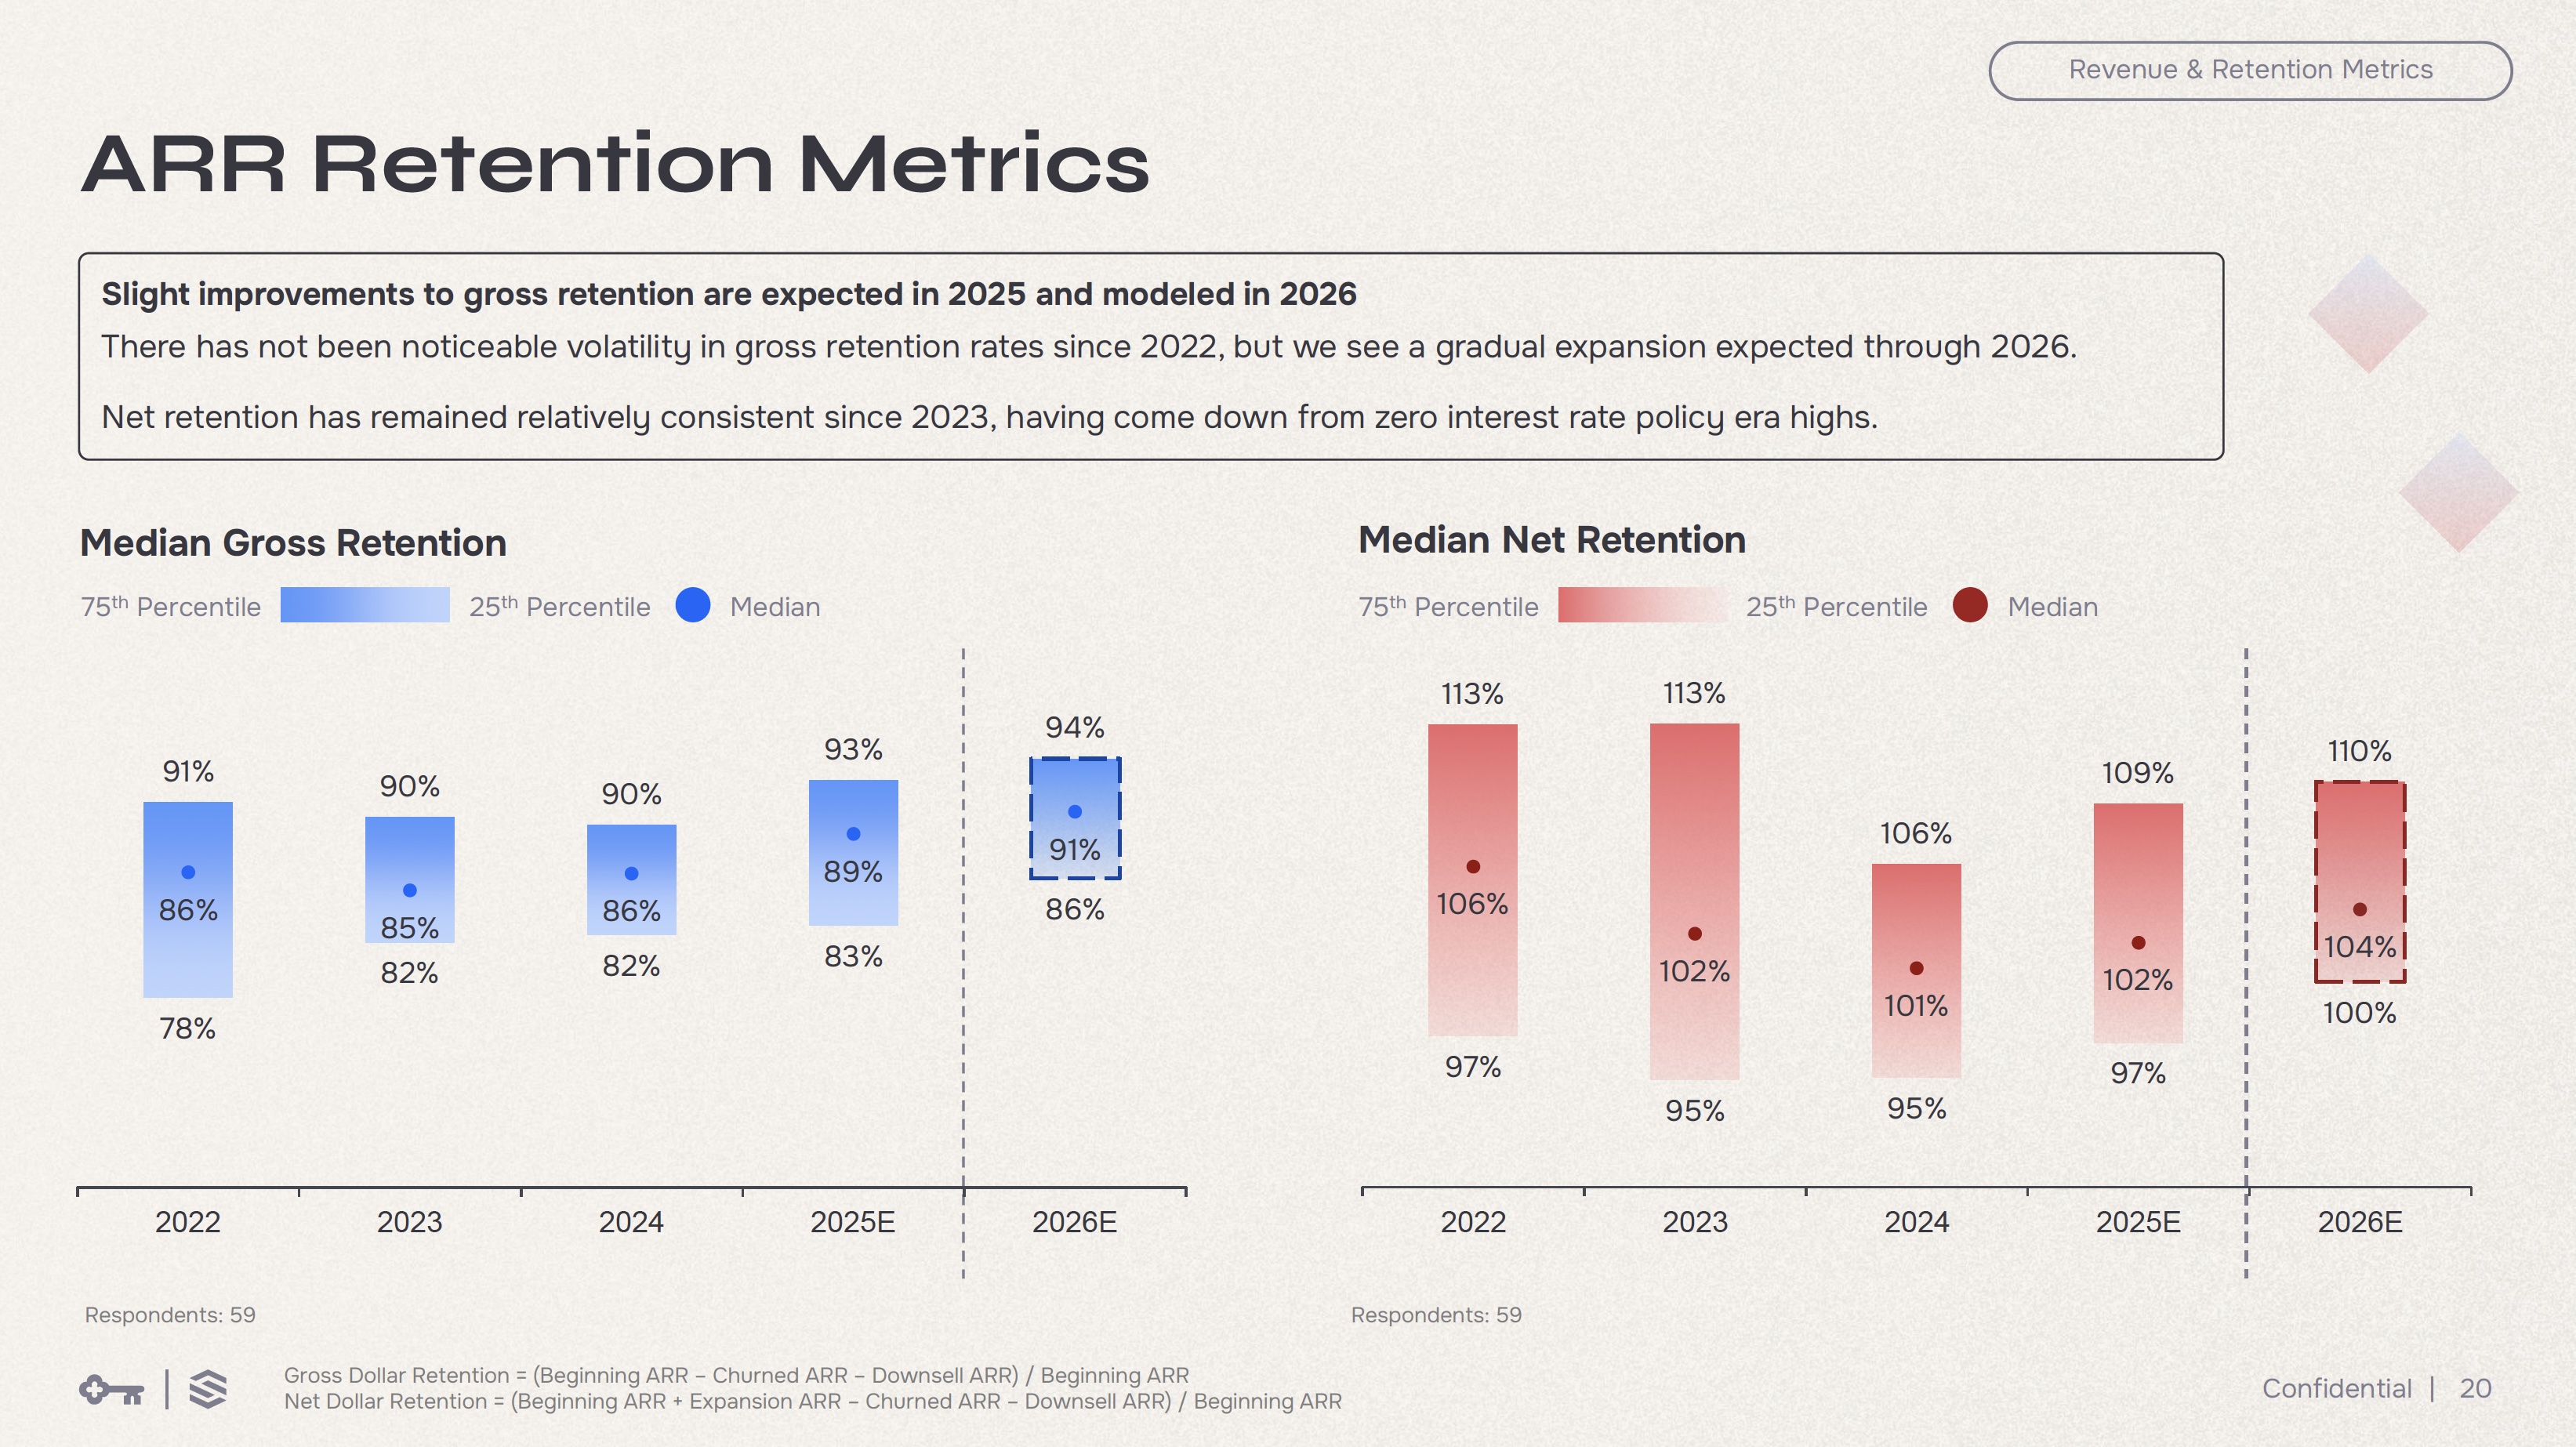
According to the KeyBanc Capital Markets & Sapphire Ventures Annual SaaS Survey (16th annual, released November 2025), median NRR across private SaaS companies has been remarkably consistent: 106% in 2022, 102% in 2023, 101% in 2024, with expectations of 102% in 2025 and 104% in 2026. Top quartile companies maintained NRR between 106% and 113% throughout that period. The survey also found that AI-native and AI-enabled companies consistently outperformed their peers on NRR (102% vs 100% in 2024), with the gap expected to widen through 2026.
Note that these are not average SaaS companies. The 2025 curvey included 71 respondents with a median 2024 ARR of approximately $23 million. the majority areinstitutionally backed (45 VC-backed, 20 RE-backed, 6 independent) and primarily North American (53 of 71). By AI posture, 36 companies identified as AI-native or AI-enabled, 19 as AI-interested, and zero as non-AI. This is a high-quality sample to benchmark against, but not representative of a random sample ofSaaS companies in the market.
Digging deeper: customer cohorts
Like with logo churn, we can perform a cohort analysis of different customer segments. Typical cohorts you might consider analyzing:
- Year/ month cohorts
- Cohort by product/ service
- Customer cohorts by contract length
- Cohorts based on the length of time as a customer (customers over 3 months or 1 year)
- Customer size cohorts (either based on the size of customer or amount of revenue generated)
Slicing the data this way will give us a more full story and help management make better decisions.
I hope this series has been useful as you look to learn and improve your business. Feel free to contact us if you’d like us to take a look at your company. Good luck!