


John Paterson
Founder & CEO, Quadshift
Is your recurring revenue valuable? Here’s how to find out.
Part 1: How to calculate recurring revenue/SaaS/churn metrics.
In a previous article, I wrote about why recurring revenue business models are ideal. Check that out if you haven’t yet, but in the next series of articles, I’ll review how to analyze recurring revenue and determine its quality. This piece speaks to how you can calculate those metrics. This does get somewhat technical, but I keep calculations out of it (mostly) so you can follow the logic rather than the math.
Reminder: why do we care about analyzing recurring revenue?
High-quality recurring revenue is valuable. For business owners, it means you are providing a product or service that your customers value — so much so that they find it difficult to leave and, ideally, they spend more money with you over time.
Step 1: Prepare the data.
Unless you have a tool that tracks revenue by customer and calculates your recurring revenue metrics automatically, you can use a spreadsheet. Tools like ChartMogul, Baremetrics, or ProfitWell can automate much of this if your billing system integrates with them.
Side note: You will want to go through the exercise of recording revenue as earned rather than when a customer pays you. This can be quite the project if you are transitioning historicals, but you will need to do it to get your books in line and report revenue correctly. Do that before calculating these metrics, otherwise, the results of your analysis won’t be useful.
One more note: if you are building this from scratch in a spreadsheet, AI tools like ChatGPT or Claude can help you structure the model, write the formulas, and troubleshoot edge cases (like customers who pause and return, or mid-period upgrades). At Quadshift, we built ur own AI-built SaaS metrics platform that automates this entire process across our portfolio. Whether you use a tool or a spreadsheet, the logic described below is what matters.
We want historical revenue information so that we can spot any trends over time, and then as we get closer to the current period, we want monthly data.
Monthly data is important (at least for the previous two years) so that we can properly calculate if a customer has churned. If services are provided monthly, and the revenue is the same each month, then it is quite simple. However, you may not earn the same amount from customers each and every month. Maybe seat/user counts fluctuate, or there is some usage-based pricing, or maybe your subscription agreement permits customers to skip months or pause their subscription. We don’t want to improperly categorize a churn, so determine your definitions and remain consistent. The monthly data allows you to create a trailing total for an extended period (if needed) that is relevant to determining churn.
Get your revenue by customer organized like this:
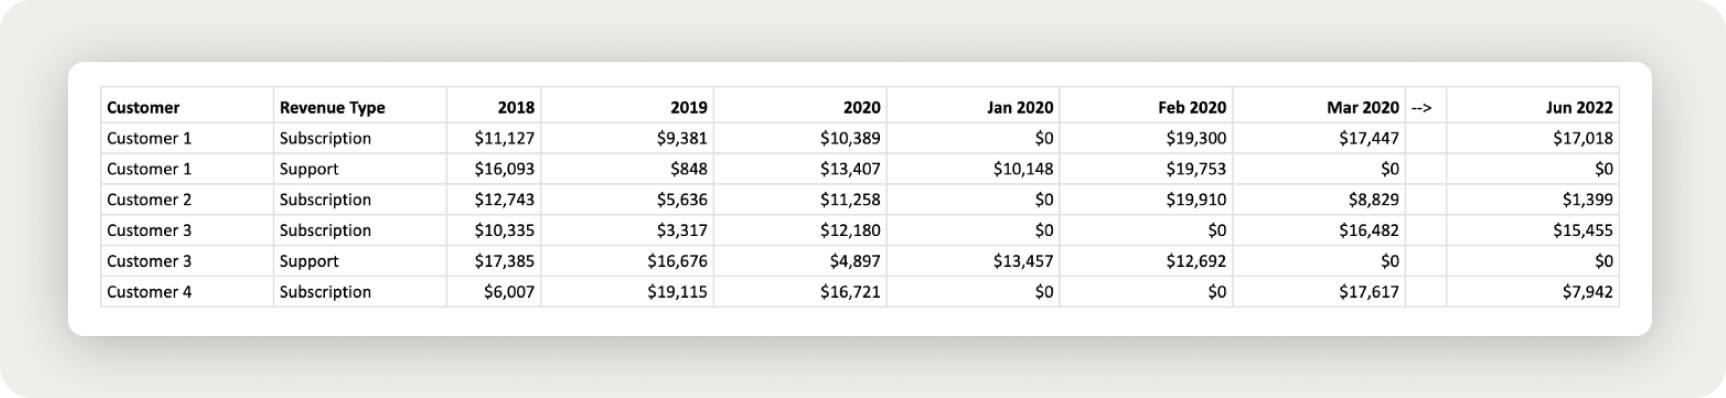
Step 2: Calculate your SaaS/ recurring revenue metrics.
Now we can build a model that spits out your metrics. You can build a schedule with the data collected that looks something like this:
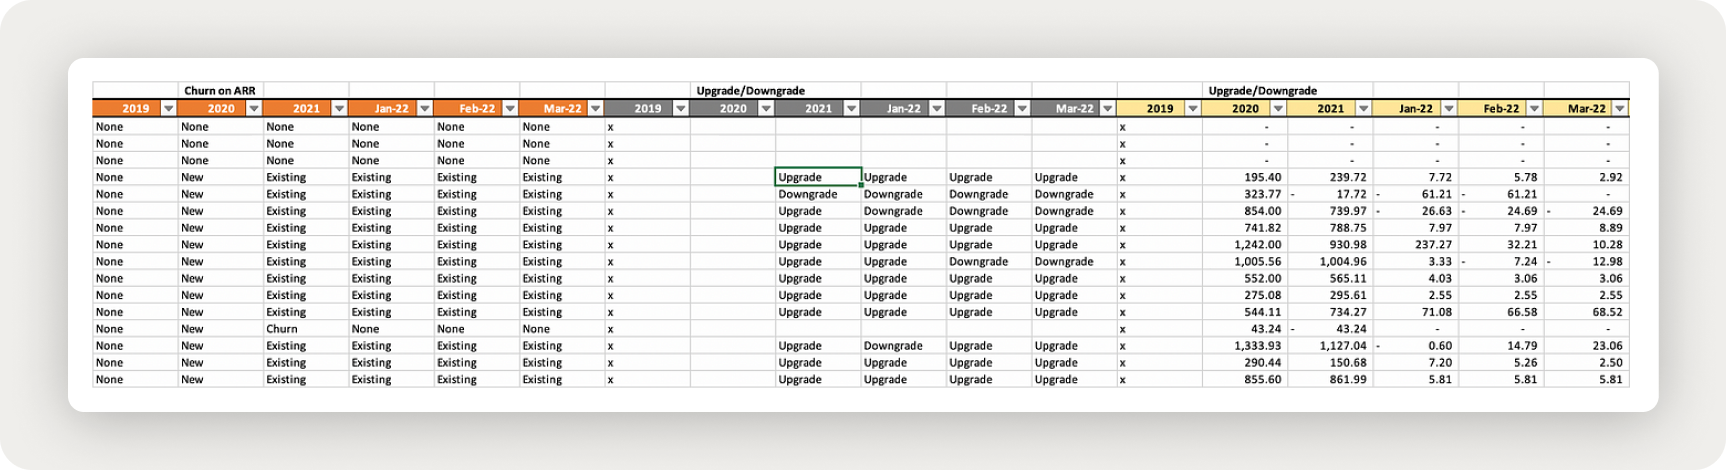
On the left is the determination of if the customer is a new, existing, churned, or returning customer, at each period of time recorded. In the middle, the logic says: if the customer is existing, did they upgrade (generate more revenue in the current period), downgrade (less revenue), or stay the same? On the far right is the change in revenue indicating new customers, churns, upgrades (often referred to as upsells or expansions), or downgrades.
Step 3: Compile the data in a “SaaS Waterfall”.
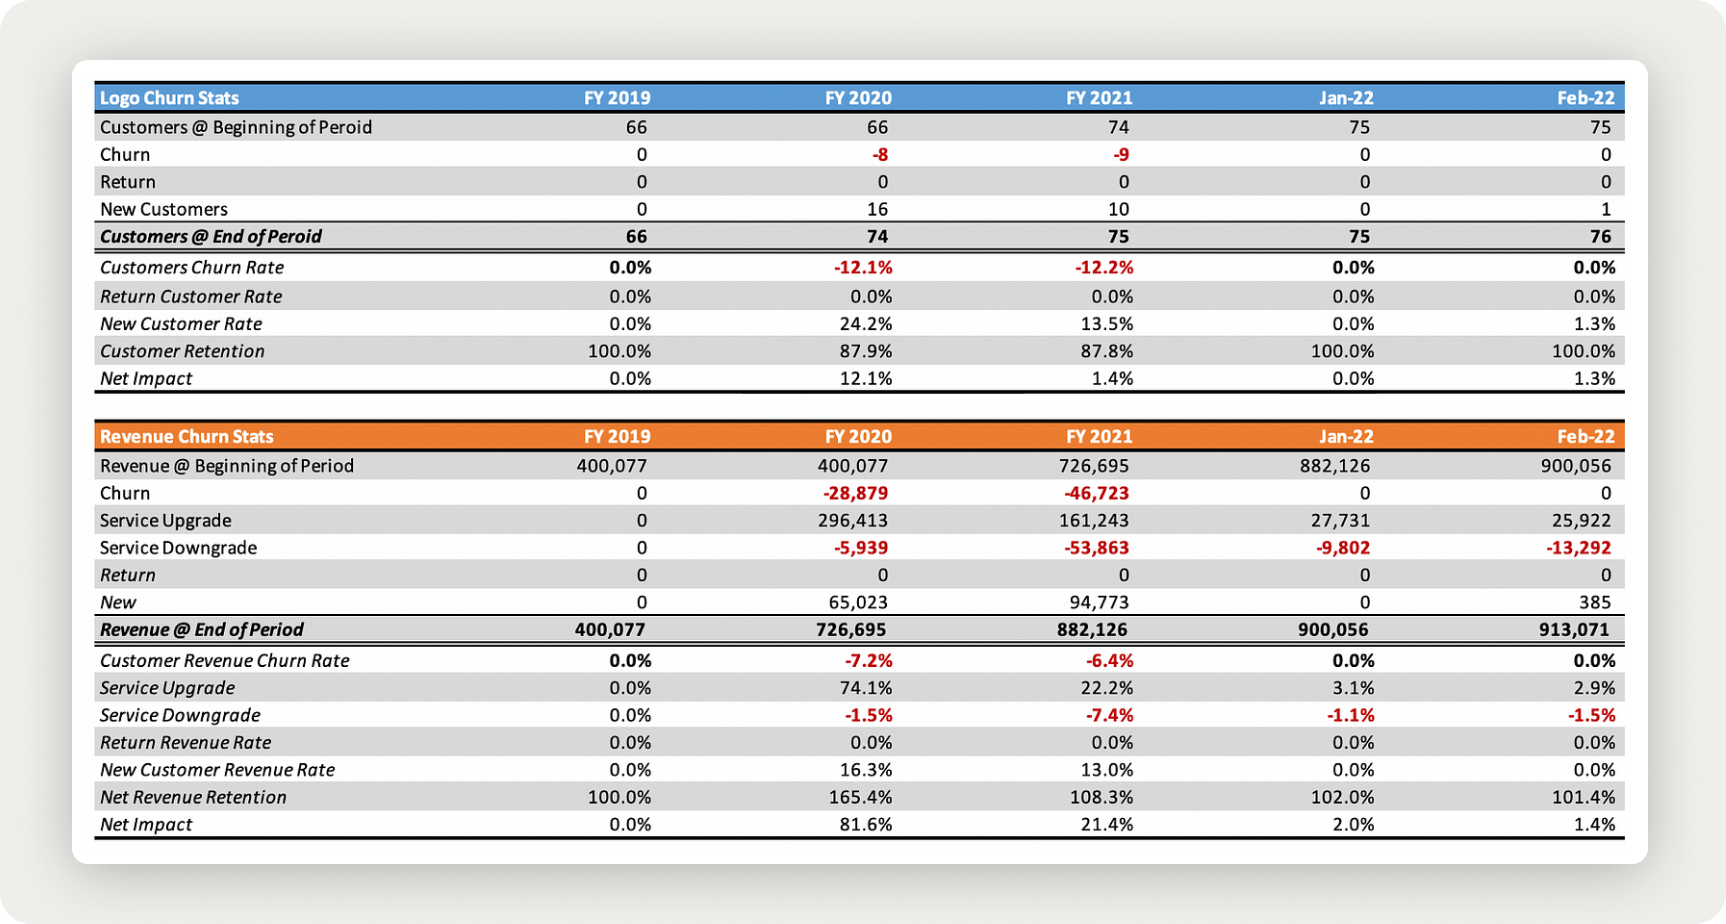
The blue section summarizes “logo churn stats”, which looks at the individual customers for each period you are analyzing. At the bottom is “revenue churn stats”, which summarizes the revenue (dollar) changes for those same periods.
To calculate Net Revenue Retention, take revenue from the previous period’s customers and sum the change in revenue from those customers in the current period.
Net Revenue Retention (NRR) = (Previous Period Revenue + (Upgrades-Downgrades-Churn))/Previous Period Revenue
If you made it here, great job!
Next up, we look at each of these metrics, what they mean, what’s good, and what needs improvement, check that article out in Part 2, here.